Hello Everyone,
This blog is to share some default dashboards & integration between SCOM & Visio.
As in previous blog, I explained that dashboard is nothing but just a diagrammatic view of monitored object so there are some default dashboards are available in SCOM which can be viewed as Diagram View which give more clear view of monitored objects with complete path.
I will show You how to check Diagram View of Monitored Objects & some default dashboards examples which further can be uploaded on Visio as well.
Part 1: To see SCOM Prerequisites & Installation Process, Click Here!
Part 2: To see SCOM Post configurations, Click Here!
Part 3: To see SCOM Console Overview, Click Here!
Part 7: To see about Reports, Click Here!
Part 8: To see about Dashboard & creating custom Dashboard, Click Here!
How to see default dashboards for monitored objects:
I will show You 1 example for Monitored Windows Computers.
Open SCOM Console, Go to Monitoring Tab, Expand Monitoring, Click on Windows Computer & then Click on Diagram View in Task on right hand side:

A new window will open so expand the objects by clicking on + sign on lower right corners on objects and that will display You a complete path of monitored objects with link connected to each other. This helps in more easy way to identify the root path for culprit object for any failure, Click Yes:

Below is the diagram view dashboard for real-time monitored object:

Some Examples:
Hyper-V VNic Metering:

Cloud Health:

Host Health:

Virtual Machine Health:

Management Group Health:

Like this, You can view many default dashboards....
Now, question may come: Why do we need to integrate SCOM with Visio & SharePoint to create Dashboard?
Answer: In simple term, To create single dashboard for different monitored required objects as per required view... We can create dynamic live dashboard as per our design on Visio which we can upload on SharePoint to give more customisation looks to dashboard.
By default, Visio only have status of objects within very small circle (Like if Green, Yellow or Red) which is difficult to give clear picture so we can upload the diagram on SharePoint & customise that in such a way that complete object will blink with Color if status is healthy then Green light will blink, if warning then Yellow and red for critical status... This is all customisation done on SharePoint after uploading live Visio Diagram on SharePoint. I will try to show that process also...
All the above thing requires integration of SCOM with Visio & SharePoint. Below I will show You how to Integrate SCOM with Visio.
SCOM Integration with Visio:
When integration is done then there are some prerequisites which should be in-place. So let's first discuss the required prerequisites for SCOM Integration with Visio.
Prerequisites:
This integration requires basic prerequisites. My lab setup is on 2012 R2 so I will share pre-requisites for the same. Below are the main prerequisites:
- SCOM Console on Visio Machine.
- Visio 2012 Premium or Professional Edition
- Microsoft Visio 2010 & SharePoint 2010 Extension for System Center 2012 - Click Here to Download
- .Net framework 3.5 SP1.
- Microsoft Visual Studio Tools for Office Runtime 2010 setup - Click Here to Download
- Make sure SCOM Web Console is working on Visio machine using FQDN.
NOTE: Create a separate machine which should be connected to domain & reachable to SCOM using FQDN on both direction. You can using either Client OS or Server for Visio Machine.
Integration Process:
Install SCOM Console on Visio Machine & connect it to Management Server to see if it is working or not:

Install Microsoft Visual Studio Tools for Office Runtime 2010 setup, Run the setup:

Click Install:

Click Finish once done:

Install Visio 2010:

Accept License:

Click Install:

Click Close once done:

Install Visio 2010 and SharePoint 2010 Extensions for System Center 2012 setup:

Click Next:

Accept License Term:

Click Next:

Click Next:

Click Close once done:

All done.
Now Open Visio Console for Post-Configuration. When You open Visio, You will see additional Tab with name - Operation Manager:

Now, before proceeding to configure, Confirm if SCOM Web Console is working using SCOM machine FQDN from Visio Machine or not:

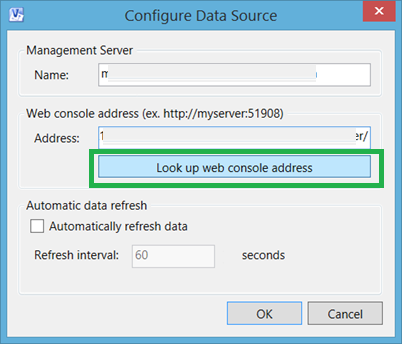
Click on Operation Manager Tab and then Click on Configure Button to integrate Visio with SCOM:

Enter SCOM Management Server Name & Web Console URL, Click on "Look up web console address" & then Click OK:

It will start integration process:

Once it is configured then SCOM Live monitoring objects links will be enabled from where You can insert all required objects to create Dashboard:

This is all about integrating SCOM with Visio.
In my next blog post, I will show You network monitoring process & how to create Live Monitoring Dashboard in Visio.
Happy Reading!!!
If You like my post then follow my updates:
Join my Facebook group for updates on trending technologies/technical references/issues etc:
Part 1: To see SCOM Prerequisites & Installation Process, Click Here!
Part 3: To see SCOM Console Overview, Click Here!
Part 7: To see about Reports, Click Here!
Part 8: To see about Dashboard & creating custom Dashboard, Click Here!
How to see default dashboards for monitored objects:
I will show You 1 example for Monitored Windows Computers.
Open SCOM Console, Go to Monitoring Tab, Expand Monitoring, Click on Windows Computer & then Click on Diagram View in Task on right hand side:

A new window will open so expand the objects by clicking on + sign on lower right corners on objects and that will display You a complete path of monitored objects with link connected to each other. This helps in more easy way to identify the root path for culprit object for any failure, Click Yes:

Below is the diagram view dashboard for real-time monitored object:

Some Examples:
Hyper-V VNic Metering:

Cloud Health:

Host Health:

Virtual Machine Health:

Management Group Health:

Like this, You can view many default dashboards....
Now, question may come: Why do we need to integrate SCOM with Visio & SharePoint to create Dashboard?
Answer: In simple term, To create single dashboard for different monitored required objects as per required view... We can create dynamic live dashboard as per our design on Visio which we can upload on SharePoint to give more customisation looks to dashboard.
By default, Visio only have status of objects within very small circle (Like if Green, Yellow or Red) which is difficult to give clear picture so we can upload the diagram on SharePoint & customise that in such a way that complete object will blink with Color if status is healthy then Green light will blink, if warning then Yellow and red for critical status... This is all customisation done on SharePoint after uploading live Visio Diagram on SharePoint. I will try to show that process also...
All the above thing requires integration of SCOM with Visio & SharePoint. Below I will show You how to Integrate SCOM with Visio.
SCOM Integration with Visio:
When integration is done then there are some prerequisites which should be in-place. So let's first discuss the required prerequisites for SCOM Integration with Visio.
Prerequisites:
This integration requires basic prerequisites. My lab setup is on 2012 R2 so I will share pre-requisites for the same. Below are the main prerequisites:
- SCOM Console on Visio Machine.
- Visio 2012 Premium or Professional Edition
- Microsoft Visio 2010 & SharePoint 2010 Extension for System Center 2012 - Click Here to Download
- .Net framework 3.5 SP1.
- Microsoft Visual Studio Tools for Office Runtime 2010 setup - Click Here to Download
- Make sure SCOM Web Console is working on Visio machine using FQDN.
NOTE: Create a separate machine which should be connected to domain & reachable to SCOM using FQDN on both direction. You can using either Client OS or Server for Visio Machine.
Integration Process:
Install SCOM Console on Visio Machine & connect it to Management Server to see if it is working or not:

Install Microsoft Visual Studio Tools for Office Runtime 2010 setup, Run the setup:

Click Install:

Click Finish once done:

Install Visio 2010:

Accept License:

Click Install:

Click Close once done:

Install Visio 2010 and SharePoint 2010 Extensions for System Center 2012 setup:

Click Next:

Accept License Term:

Click Next:

Click Next:

Click Close once done:

All done.
Now Open Visio Console for Post-Configuration. When You open Visio, You will see additional Tab with name - Operation Manager:

Now, before proceeding to configure, Confirm if SCOM Web Console is working using SCOM machine FQDN from Visio Machine or not:

Click on Operation Manager Tab and then Click on Configure Button to integrate Visio with SCOM:

Enter SCOM Management Server Name & Web Console URL, Click on "Look up web console address" & then Click OK:
It will start integration process:

Once it is configured then SCOM Live monitoring objects links will be enabled from where You can insert all required objects to create Dashboard:

This is all about integrating SCOM with Visio.
In my next blog post, I will show You network monitoring process & how to create Live Monitoring Dashboard in Visio.
Happy Reading!!!
If You like my post then follow my updates:
Join my Facebook group for updates on trending technologies/technical references/issues etc:

CAD0F8921C
ReplyDeletehacker bulma
hacker kiralama
tütün dünyası
hacker bulma
hacker kirala
ReplyDeleteİnternet üzerinde oyun oynamayı sevenler için çeşitli platformlar bulunuyor. Bunlardan biri olan https://oyun.indir.biz.tr/ adresi, kullanıcılarına geniş oyun seçenekleri sunmaktadır. Herkesin ilgi alanına uygun oyunları burada bulmak mümkündür. Ayrıca, site kolay kullanımıyla da tercih sebebidir. Eğer siz de yeni oyunlar keşfetmek istiyorsanız, bu platformu ziyaret edebilirsiniz.
C94D04E2
ReplyDeleteKırıkkale Esçort
Nevşehir Esçort
Bolu Esçort
Balıkesir Esçort
Urfa Esçort
Niğde Esçort
Karaman Esçort
Kayseri Esçort
Ardahan Esçort