Hello Everyone,
In this blog, I will share the process to create Live Monitoring Dashboard of different monitored services, applications, network, servers etc on single Visio Dashboard diagram.
Whenever status for any monitored objects will change, it will be reflected on the Visio Diagram as well. You can design the architecture diagram for Your infrastructure as per your need & design. The same can be viewed on large LED Screens as well for monitoring.
Part 1: To see SCOM Prerequisites & Installation Process, Click Here!
Part 2: To see SCOM Post configurations, Click Here!
Part 3: To see SCOM Console Overview, Click Here!
Part 7: To see about Reports, Click Here!
Part 8: To see about Dashboard & creating custom Dashboard, Click Here!
Part 1: To see SCOM Prerequisites & Installation Process, Click Here!
Part 3: To see SCOM Console Overview, Click Here!
Part 7: To see about Reports, Click Here!
Part 8: To see about Dashboard & creating custom Dashboard, Click Here!
Part 9: To see Default Dashboard & SCOM Integration with Visio, Click Here!
Part 10: To see network device monitoring process, Click Here!
Let's start with the process for creating dashboard....
Creating Live Monitoring Dashboard in Visio:
Open Visio which is integrated with SCOM, Click on Create:

Click on Operation Manager & Click on Configure to re-connect to SCOM Server:

Click OK:

Drag and Drop rectangle box on screen on which You can create dashboard just to make it good looking design:

Change colour of box as per Your need:

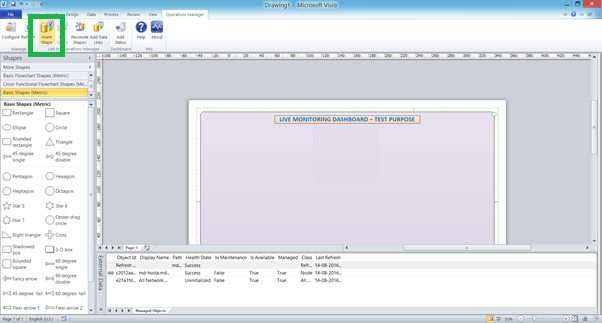
Click on Insert Shape:
Choose required class which You want:

Click on Other Class to see long list of other classes which You can choose as per need to add monitored objects on dashboard:

Select Object & Click Insert:

Using same process You can choose multiple classes one by one and can add different objects on dashboard as shown below:

Now use connectors to link these objects to make path:

If You notice each objects then You can see status of each objects on top right corner of each objects with Symbol in circle with Green, Yellow & Red status.... If these status changes in SCOM then that will be reflected in Visio Diagram as well:

NOTE: Names for each objects are picked up automatically from SCOM itself.
To make it more customisation by making status on complete object image & connectors instead of only small symbol in circle, You need to further integrate Visio with SharePoint & upload the Visio file on SharePoint.... There You can make this Live Dashboard more attractive and easy looks to monitor objects.
This live Dashboard helps different linked objects to be monitored through single dashboard with Live status and helps easily identify the culprit path & objects.
Hope You will like this post more than others... :)
Happy Reading!!!
If You like my post then follow my updates:
Join my Facebook group for updates on trending technologies/technical references/issues etc:

Hi , have a look at proview , this does they same but doesn't need the sharepoint overhead and can also display graphs , counters and monitor states. http://www.opslogix.com/proview/ thanks, Michel
ReplyDeleteGood One, I will Test the same in lab :)
DeleteThanks!
42EC5BF110
ReplyDeletekiralık hacker
hacker arıyorum
kiralık hacker
hacker arıyorum
belek
815168D8C0
ReplyDeletekiralık hacker
hacker kirala
tütün dünyası
hacker bul
hacker kirala